What data are in the Georgia APCD graphic.png
An official website of the State of Georgia.
The .gov means it’s official.
Local, state, and federal government websites often end in .gov. State of Georgia government websites and email systems use “georgia.gov” or “ga.gov” at the end of the address. Before sharing sensitive or personal information, make sure you’re on an official state website.
Still not sure?
Call 1-800-GEORGIA to verify that a website is an official website of the State of Georgia.
March 01, 2024
The Georgia APCD began receiving submissions of medical claims data in June 2023 and is poised to become a valuable resource for Georgians, from health care consumers and providers to policymakers and researchers. In the coming months, we will be releasing a variety of dashboards and data from the APCD exploring a number of use cases, ranging from chronic disease to costs of care.
As excited as we are to begin sharing APCD data, we remain cognizant of Mark Twain's classic cautionary take on statistics. We believe that it is essential for us to provide both context and tools to support informed exploration and use of these data by all citizens of the state.
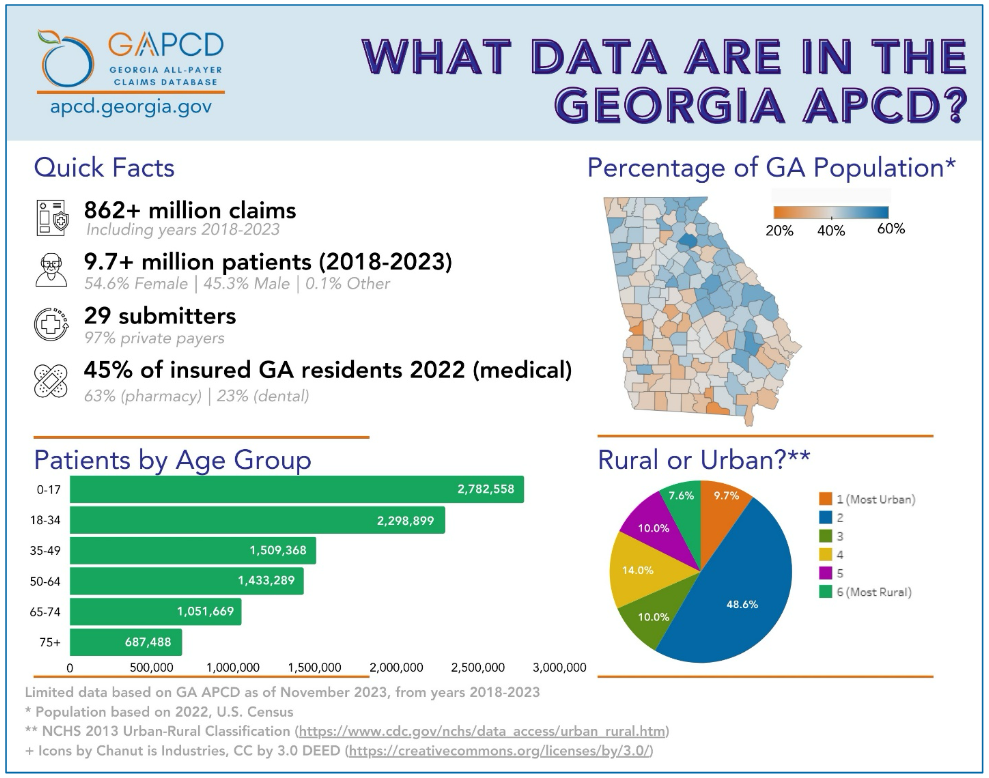
We begin with this reasonably straightforward question, "What do Georgians spend on healthcare?" The APCD, as a collection of healthcare claims data, is well-positioned to help answer this question. Nonetheless, it is important to note that the population of the Georgia APCD is only a subset of the actual Georgia population. To get a baseline understanding of the data in the Georgia APCD, please visit the APCD Snapshot dashboard and accompanying methods. Here is an overview of the population of the Georgia APCD.
Some key points to note:
With these considerations in mind, we can begin to look at health cost expenditures amongst those individuals in the APCD. When considering costs of care, we will consider two perspectives. One is from the vantage point of healthcare payers, which might include government, commercial insurers, or employers. In this case, we measure costs by looking at the average expenditures for the entire APCD population, including both those who received care and those who did not. This metric is sometimes referred to as per member per month (PMPM) costs, or per member per year (PMPY) costs, and it adjusts for the fact that a given individual may not be covered in the database for the entire year. Below is a breakdown of per member per year costs for the Georgia APCD population, limited to those who reside in Georgia.
In this chart, expenditures are broken down into 4 major categories: Inpatient, Outpatient, Professional (i.e., provider services), and Pharmacy. To see the chart in greater detail, feel free to hover over the bars or click the categories up top to hide or remove them. What stands out is the the growth in costs from 2018 to 2022. This was, of course, a turbulent period in healthcare due to Covid-19, which resulted in increased costs in some aspects of healthcare and decreased costs in other regards. One of the challenges with the Georgia APCD being in its early stages is that some "historical data" (i.e., 2018, 2019) may have been submitted completely by some payers but not by others. Thus, it is likely that the significantly lower expenditures seen in the left part of the chart may change as we receive more complete data from all sources.
Nevertheless, there are some important findings here. While prices have nudged up only slightly since 2020, the pattern is not consistent across the board. Take a look at the slope graph below to get a true picture of what is happening. It becomes clear that Professional services and Outpatient expenditures have increased over 10% since 2020, while Inpatient and Pharmacy expenditures have seen a relative decrease in spending.
A fair question to ask, given our various considerations regarding the ongoing evolution of the APCD data, is whether our findings on expenditure are an accurate reflection of the overall Georgia population. In comparing our findings with the National Health Expenditure data put out by the Centers of Medicare and Medicaid Services (CMS), we find an overall good consistency with metrics on total health expenditures. CMS calculates Georgia's overall per person health expenditures for 2020 as $8587, about 8% above our calculation of $7,914. This is reasonably close, but why might we be arriving at a lower number? If you'll recall from our discussion above, the Georgia APCD population currently skews younger than the actual population and does not yet contain Medicaid and traditional Medicare data. As a result, we expect slightly lower expenditures on average compared with the true Georgia population. This gap should close as the APCD data becomes fully populated.
Looking at data from across the population sometimes does not align with our experience of costs at the individual patient level. One of the odd things about the medical expenditures shown above is how low the costs actually seem for inpatient care. Certainly $1500 does not sound like the cost of a hospitalization, and indeed it is not. By looking at average costs for everyone in the population, whether they received care or not, we dilute the cost of inpatient events, which are very expensive but relatively rare. Let's take a new look at our chart, but focusing only on patients who actually received care in these different categories.
Now things have gotten much more expensive for every category, particularly for inpatient services which in this case have a per-person average of over $28,000. There are several key things to note. First and most importantly, this is not the average cost of a single hospitalization, but rather the average cost of hospital services over the course of the year for those who are hospitalized. Many of these individuals will be hospitalized multiple times in a year. So what is the average cost per hospitalization? Take a look at the graph below to see the answer. The costs we find in the Georgia APCD are similar to national averages, which vary by state but are approximately $13,000 per hospitalization. We will be going more more deeply into costs for acute care in forthcoming analyses, but suffice to say there is wide variation in these costs, both across the state and the country.
One additional consideration, before we leave this topic, is whether the use of averages is a good idea when looking at healthcare costs. Much of the time we will use the "median", which we calculate by lining up all the costs of a particular expense from lowest to highest and picking the middle one. This gives a value typically less influenced by extremes, such as a $250,000 hospitalization. If we do this for hospital visits, the median cost for an inpatient stay is much lower, around $7,000. We used averages here because it is consistent with the methodologies used by many prior analyses on this topic, such as those by the Health Care Cost Institute and CMS. But indeed medians are an important measure that we will use in many future analyses of the Georgia APCD. As for the slight variation between the many legitimate ways to answer the question "what do Georgians spend on health care", keep in mind those words of Mark Twain and don't move too quickly to rely on any single statistic without the necessary context.
Final Thoughts and a Look Ahead
Based on our introductory exploration of healthcare costs, you should have many reasons to feel confident that the Georgia APCD will be an extremely valuable resource for understanding healthcare in Georgia. Hopefully, you have also identified several areas to look out for as the APCD database continues to evolve.