Ghost rates image.png

An official website of the State of Georgia.
The .gov means it’s official.
Local, state, and federal government websites often end in .gov. State of Georgia government websites and email systems use “georgia.gov” or “ga.gov” at the end of the address. Before sharing sensitive or personal information, make sure you’re on an official state website.
Still not sure?
Call 1-800-GEORGIA to verify that a website is an official website of the State of Georgia.
Federal price transparency regulations now mandate that health insurers publish their negotiated rates through machine-readable files (MRFs) [1]. However, limited information exists on whether these published rates accurately represent what providers actually charge. This analysis compares negotiated rates from insurer transparency data to actual claim costs in the Georgia All-Payer Claims Database (APCD) to assess transparency disclosures and identify discrepancies.
We worked with two main data sources: transparency in coverage (TIC) files from insurers dated January 2026, which list negotiated rates for specific provider-plan-procedure combinations, and Georgia APCD medical insurance claims data across Georgia from 2024-2025.
We began with 7 billion provider records and 2 billion cost records from the TIC files. We cleaned these records and flattened concatenated fields before merging them to produce provider-rate combinations. These combinations were matched to National Provider Identifier (NPI) data. Restricting the data to providers with at least one claim in Georgia yielded 40.1 billion distinct provider-rate records. For claims, we began with 230 million records from Georgia’s APCD from 2024 to 2025. The claims data were then filtered to 369 procedure codes shared with the TIC data. Only in-network commercial claims were kept, and outliers outside the 5th-95th percentile range of costs were also excluded to improve data quality. The final claims dataset contained 23.1 million records.
To further refine the TIC data, we considered “ghost rates.” Ghost rates are negotiated rates published for provider-procedure combinations that are absent from claims data. This discrepancy implies that the published rate may not reflect an actively delivered service. We therefore excluded provider-procedure-rate records for which the provider had fewer than 5 claims for that procedure. This process left us with 2.9 billion distinct “non-ghost” records in our final TIC dataset.
The analysis connected 2.9 billion TIC negotiated rates to APCD claims to evaluate the comprehensiveness and usability of the published transparency data. We examined match rates at three progressively specific levels: 1) payer only, 2) payer and procedure, and 3) payer, procedure and provider. The results show a dramatic decline in match rates as specificity increases.
| Match Level | Criteria | Negotiated Rates Matched | Claims Matched | Match Rate to APCD Claims |
|---|---|---|---|---|
| Level 1 | Payer only | 2.9 billion | 22.8 million | 98.44% |
| Level 2 | Payer + Procedure | 2.9 billion | 20.3 million | 87.96% |
| Level 3 | Payer + Procedure + Provider | 66.9 million | 1.7 million | 7.27% |
Nearly all claims (98.44%) matched to at least one TIC file at the payer level, indicating broad data availability and strong compliance with transparency requirements among major insurers. The majority of claims (87.96%) matched at the procedure level, suggesting that published rates cover most common healthcare services. The unmatched claims may reflect data limitations for specialized services or less common procedures. Only 7.27% of claims could be matched to provider-specific negotiated rates, representing a substantial gap in actionable price transparency.
Among the 92.73% of claims that failed to match at the provider-specific level, 10.48% had no published rates for that procedure at all; 82.25% had published rates for the procedure but not for the specific provider who performed it. While payers publish rates for procedures, they often don't publish rates for the specific providers who actually deliver those services.
When examining published TIC rates, we found a low rate of correspondence with observed claims. Using Georgia NPI and APCD claims data, we estimated an inclusion rate of 2.35%, meaning that only 2.35% of published TIC rates had a matching payer-procedure-provider combination supported by claims activity. Accordingly, 97.65% of published TIC rates were classified as ghost rates, with no corresponding claims activity.
Among the 7.27% of claims that successfully matched at the payer-procedure-provider level, we analyzed whether the actual claim costs fell within the negotiated rate ranges published in TIC files. This analysis revealed significant discrepancies between published rates and actual cost of claims.
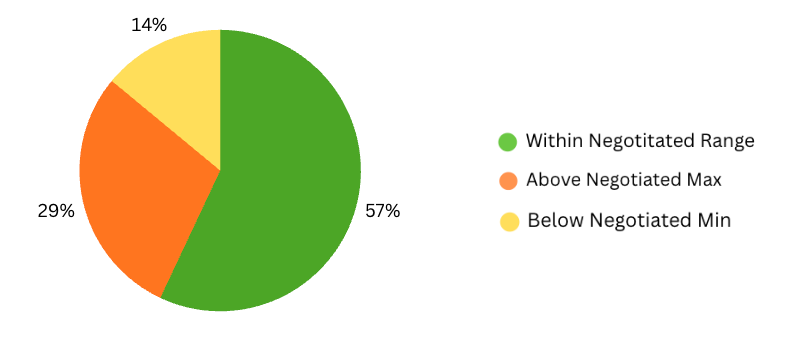
Of claims that matched at the payer-procedure-provider level, 56.93% had total costs within the negotiated rate range reported in the TIC data. Another 14.01% fell below the published minimum negotiated rate, while 29.05% exceeded the published maximum. While a majority of claims aligned with published rates, over 43% of matched claims fell outside the expected range.
Many out-of-range claims fell well outside the published negotiated rates. Among claims above the range, a substantial subset was more than 25% above the maximum negotiated rate. Similarly, among claims below the range, some were more than 25% below the minimum negotiated rate.
| Cost Deviation from TIC Negotiated Range | Claim Count | % of Total Claims |
|---|---|---|
| More than 50% Below | 19,813 | 1.18% |
| More than 25% Below | 58,363 | 3.47% |
| More than 10% Below | 103,932 | 6.17% |
| Within 10% of TIC Range | 1,283,888 | 76.24% |
| More than 10% Above | 296,009 | 17.58% |
| More than 25% Above | 251,260 | 14.92% |
| More than 50% Above | 192,056 | 11.41% |
The prevalence of out-of-range claims indicates that published negotiated rates provide an imperfect predictor of actual healthcare costs, even when payer, procedure, and provider are all precisely matched.
To illustrate the relationship between actual claim costs and published negotiated rates, we examined knee replacement procedures across the same providers but different payers. We specifically examined professional fees for knee replacement procedures (CPT code 27447). For this specific procedure code in the professional billing class, we identified 276,643 published TIC negotiated rates that matched to claims at the payer-procedure-provider level. We selected a few providers who perform knee replacements and compared their published TIC rates against median claim costs across multiple payers. These providers were chosen because they had claims activity with multiple payers, allowing for direct cross-payer comparison.
| Payer | Provider | TIC Negotiated Range | Median Claim Cost | % Claims Within TIC Range | % Claims Below TIC Min | % Claims Above TIC Max |
|---|---|---|---|---|---|---|
| Aetna | A | $389 - $3,889 | $1,845 | 100.0% | 0.0% | 0.0% |
| Centene | A | $305 - $2,431 | $2,292 | 68.4% | 0.0% | 31.6% |
| Cigna | A | $2,113 - $2,113 | $3,285 | 0.0% | 0.0% | 100.0% |
| Payer | Provider | TIC Negotiated Range | Median Claim Cost | % Claims Within TIC Range | % Claims Below TIC Min | % Claims Above TIC Max |
|---|---|---|---|---|---|---|
| Aetna | B | $389 - $3,889 | $1,801 | 100.0% | 0.0% | 0.0% |
| Alliant Health Plans | B | $1,887 - $2,346 | $1,801 | 0.0% | 100.0% | 0.0% |
| Centene | B | $11,317 - $11,317 | $1,646 | 0.0% | 100.0% | 0.0% |
| Payer | Provider | TIC Negotiated Range | Median Claim Cost | % Claims Within TIC Range | % Claims Below TIC Min | % Claims Above TIC Max |
|---|---|---|---|---|---|---|
| Aetna | C | $389 - $3,889 | $2,594 | 100.0% | 0.0% | 0.0% |
| Centene | C | $11,317 - $11,317 | $1,656 | 0.0% | 100.0% | 0.0% |
| Cigna | C | $2,113 - $2,113 | $3,260 | 0.0% | 0.0% | 100.0% |
| Payer | Provider | TIC Negotiated Range | Median Claim Cost | % Claims Within TIC Range | % Claims Below TIC Min | % Claims Above TIC Max |
|---|---|---|---|---|---|---|
| Aetna | D | $328 - $3,280 | $1,396 | 100.0% | 0.0% | 0.0% |
| Centene | D | $289 - $1,216 | $1,716 | 20.0% | 0.0% | 80.0% |
| Payer | Provider | TIC Negotiated Range | Median Claim Cost | % Claims Within TIC Range | % Claims Below TIC Min | % Claims Above TIC Max |
|---|---|---|---|---|---|---|
| Centene | E | $305 - $2,431 | $2,273 | 73.9% | 0.0% | 26.1% |
| Cigna | E | $2,113 - $2,113 | $3,269 | 0.0% | 0.0% | 100.0% |
| Payer | Provider | TIC Negotiated Range | Median Claim Cost | % Claims Within TIC Range | % Claims Below TIC Min | % Claims Above TIC Max |
|---|---|---|---|---|---|---|
| Aetna | F | $374 - $3,741 | $2,298 | 100.0% | 0.0% | 0.0% |
| Centene | F | $307 - $2,257 | $1,961 | 100.0% | 0.0% | 0.0% |
| Cigna | F | $2,482 - $2,482 | $3,416 | 0.0% | 0.0% | 100.0% |
The cross-payer comparison reveals dramatic variation in TIC data accuracy across insurers for identical providers and procedures. Published negotiated rates for knee replacements show considerable spread between minimum and maximum values. Some payer-provider groups show median claim costs that fall within the published rate range, while others exceed or fall below the stated bound. Individual providers showed consistent actual cost patterns across payers. The median claim costs for the same provider typically varied by only 20-30% between payers, however published rate accuracy ranged from 0% to 100% alignment. Data quality issues were also evident, including anomalous published rates that exceeded actual costs by 400-500%. For consumers attempting to use TIC data for healthcare shopping, published rates for the same provider could differ from actual costs by $500-$1,200 (25-55%), potentially leading to surprise bills despite consulting transparency tools. The consistency of these patterns across multiple providers suggests systematic issues in how certain payers publish their TIC data.
There are substantial differences across insurance payers in how well their published negotiated rates align with actual claim costs. Aetna shows the strongest alignment with most claims falling within published ranges, while Anthem and Cigna show the poorest alignment with roughly 40-50% of claims exceeding published maximums. Oscar Health shows many claims falling below published minimums, suggesting overestimation in their TIC files. This payer-level variation indicates that TIC file accuracy is inconsistent across the insurance industry, meaning consumers and researchers cannot assume uniform data quality when using these files for price transparency purposes.
| Payer | % Claims Within TIC Range | % Claims Below TIC Min | % Claims Above TIC Max |
|---|---|---|---|
| Aetna | 61% | 13% | 26% |
| Alliant Health Plans | 34% | 34% | 32% |
| Anthem | 4% | 12% | 84% |
| Centene | 61% | 13% | 26% |
| Cigna | 30% | 17% | 53% |
| Oscar Health | 10% | 88% | 2% |
| UnitedHealthcare | 36% | 24% | 40% |
We next compared the spread of published TIC rates with the spread of actual paid amounts within the same provider-payer-procedure combinations. To make variability comparable across low- and high-cost services, we measured each group’s relative range, defined as the distance between the minimum and maximum values relative to the average. Among 84,665 provider-payer-procedure combinations, 52,534 had at least two claims and at least two negotiated rates and were included in this analysis, representing about 1.4 million claims. The variability comparison can be seen in the figure below.
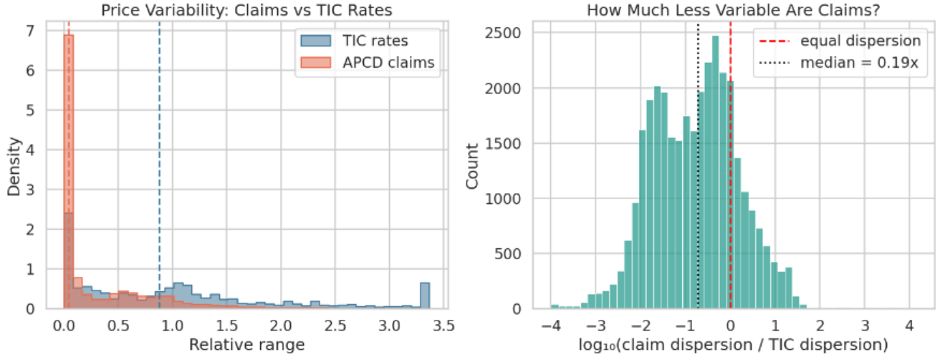
In aggregate, claim payments were tightly clustered within groups, with a median relative range of about 0.04. Published TIC negotiated rates were much more dispersed, with a median relative range of about 0.87. In other words, the typical spread of claim payments was roughly one-fifth as large as the spread of published negotiated rates, although the exact ratio depends in part on how many rates payers report.
Looking only at relative range tells us how variable prices are, but not whether published TIC rates and claim payments fall in the same general price band. To assess that alignment, we compared the TIC range with the claim-payment range for each group. Specifically, we compared the interval [minimum negotiated rate, maximum negotiated rate] with the interval [minimum claim payment, maximum claim payment], and classified each group according to how those two ranges related to one another. The breakdown of these relationships is shown in Table 10.
| Claim Costs Alignment | Payer-Procedure-Provider Groups | % Total |
|---|---|---|
| All claims are contained within TIC range | 25,476 | 48.5% |
| Claims range fully contains all TIC rates | 5,169 | 9.8% |
| Claims range and TIC range partially overlap | 7,979 | 15.2% |
| Claims range completely above TIC range | 9,223 | 17.6% |
| Claims range completely below TIC range | 4,687 | 8.9% |
In 48.5% of groups, the full claim-payment range was contained within the TIC range; in 9.8%, the claim-payment range fully contained the range of TIC rates. In the remaining groups, the claim-payment range lay entirely above the TIC range in 17.6% and entirely below it in 8.9%. In 15.2% of cases, there was only partial overlap between the claim-payment range and the TIC range. Overall, these patterns indicate that overlap between published TIC ranges and observed claim-payment ranges is common but incomplete. Consistent with the earlier finding that claim payments are typically less variable than TIC rates, claim-payment ranges often occupy only a subset of the TIC range. At the same time, the substantial share of groups with no overlap suggests that the discrepancies observed in the earlier claim-level analysis reflect not only differences in dispersion, but also systematic shifts in where realized payments fall relative to published negotiated rates.
One potential explanation for above-range claims is the absence of modifier data in TIC files. Modifiers are two-digit codes appended to procedure codes that indicate variations in service delivery (e.g., bilateral procedures, increased complexity, multiple procedures). These modifiers can substantially increase reimbursement, but TIC files report only base procedure code rates. Claims data includes modifiers that may significantly affect costs, but modifier data is not well populated in TIC files and for this set of common procedures, modifiers are not reported at all. This is a key limitation for comparing published rates to actual paid amounts.
Beyond modifiers, a further source of discrepancy is the temporal mismatch between our two data sources. The claims data span 2024–2025, whereas the TIC files reflect a single snapshot dated January 2026. Because insurers replace their machine-readable files each month and remove prior versions, contemporaneous TIC data for the claims period could not be obtained. Negotiated rates in effect when a claim was paid may therefore differ from those published in January 2026, which may partly explain the gaps observed between published rates and paid amounts.
The completeness of the TIC data introduces an additional constraint. We were unable to download files for CareSource and Humana, and the UnitedHealthcare files contained missing provider records. Rates for these payers are consequently absent or underrepresented, reducing coverage and potentially biasing match rates for the affected payer-procedure-provider combinations.
Finally, and most consequentially, only a small fraction of published TIC rates could be validated against actual claims. We estimated an inclusion rate of 2.35%, meaning that 97.65% of published rates were classified as ghost rates with no corresponding claims activity. Our analysis therefore rests on a small subset of the published data, which limits how broadly the findings generalize to the full universe of negotiated rates. However, this pattern is consistent with prior work: across 61 insurers, Muhlestein et al. found that 91.8% of all negotiated rates were ghost rates, with a median insurer rate of 84.3% [2]. Even among the 100 most common billing codes—which represent over half of all claims—more than 70% of rates were ghost rates [3]. The agreement between our estimate and these independent findings indicates that ghost rates are a structural feature of TIC data rather than an artifact of our specific dataset or matching approach.
Overall, this analysis shows that TIC machine-readable files appear much more complete at broader levels of comparison than they do at the provider-specific level where price transparency is most useful. While rates in the TIC data aligned well with APCD claims when grouped at the payer level and remained relatively strong at the payer-procedure level, match rates dropped substantially once provider was included in the comparison. This suggests that the published data may capture the general structure of negotiated rates, but they are much less reliable for understanding the actual prices associated with a specific service from a specific provider.
The range comparisons also show that published negotiated rates do not consistently reflect observed claim costs. In many payer-procedure-provider groups, claim payments fell outside the published TIC range or only partially overlapped with it, indicating that the negotiated rates in the files do not always represent the full range of real-world payments. Cross-payer comparisons further showed that accuracy varied substantially across insurers, even for the same provider and procedure, and in some cases published rates differed from actual costs by wide margins.
Taken together, these findings suggest that TIC files are useful for showing that negotiated rates exist and for describing broad pricing patterns, but they should be used cautiously as a source of provider-specific price information. The results indicate that published transparency data do not consistently translate into accurate estimates of actual claim costs, and that validation against claims data remains important when these files are used for research, policy analysis, or consumer decision-making.
Review the list of procedure codes included in this analysis.