Condition Explorer Dashboard
An official website of the State of Georgia.
The .gov means it’s official.
Local, state, and federal government websites often end in .gov. State of Georgia government websites and email systems use “georgia.gov” or “ga.gov” at the end of the address. Before sharing sensitive or personal information, make sure you’re on an official state website.
Still not sure?
Call 1-800-GEORGIA to verify that a website is an official website of the State of Georgia.
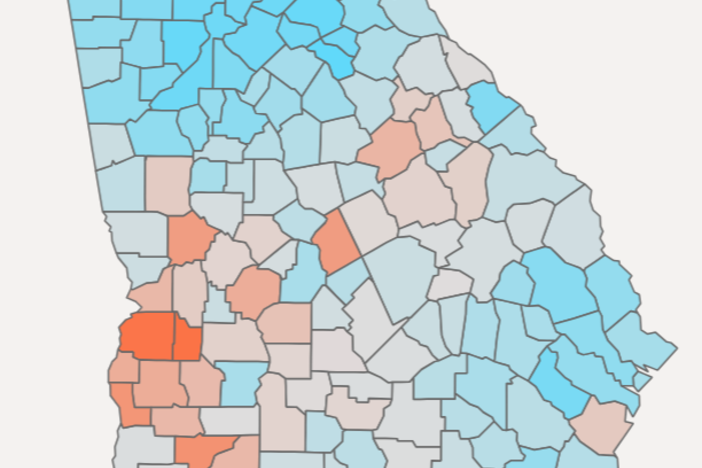
The intent of the Condition Explorer dashboard is to provide insights into the relative burden of chronic disease in Georgia. Specifically, the dashboard includes prevalence and related healthcare costs for 27 chronic diseases and cancers stratified by year, age, sex, county, and urban-rural classification. The Condition Explorer is designed for use on full-screen devices. See Methods and Limitations below for additional information on Condition Explorer metric design.
The reported prevalence estimates represent the proportion of individuals within the Georgia APCD identified as having a disease diagnosis (numerator) relative to the total population (denominator).
Patient inclusion criteria for a disease of interest follows guidance from the Centers for Medicare and Medicaid Services (CMS) Chronic Conditions Data Warehouse (CCW), which publishes a list of phenotype definitions for 30 chronic diseases (2017 forward). These definitions include valid ICD-10 codes, a lookback period, and the number and setting of qualifying claims that identify an individual as having a specific condition. For example, the CCW defines a diabetic as an individual having >=2 outpatient or >=1 inpatient encounters with a diagnosis of diabetes in prior 2 years. The set of ICD-10 codes, lookback period, and number and type of claims vary by condition. See the CCW link above for full details.
The inclusion criteria for the denominator population is given by those individuals with medical coverage in the APCD for at least one month within the given measurement year. Individual who reside outside the state of Georgia (as defined by most recent FIPS county code) are excluded from this denominator. Note that the denominator population includes all individuals, regardless of age or sex. This means that conditions that are sex-specific, such as endometrial or prostate cancer, will still utilize the full population count as denominator.
Prevalence rates are raw and have not been adjusted or “weighted” according to a target population. The data can be stratified by age, sex, county, and urban-rural classification in the dashboard. Data are suppressed for any prevalence rates that would be derived from <11 individuals, in compliance with data privacy best practices. Counties with suppressed values will be shown in white on the map.
Two cost metrics are represented in the dashboard. The first is Average Total Medical Costs. This reflects the sum of all medical claims costs, including both payer and patient paid amounts, divided by the number of individuals with this condition in the selected stratification (eg, a given year, county, age group, sex). Denied claims and “orphaned” adjustments have been removed from these cost calculations. Importantly, these calculations do not include pharmacy costs for the condition.
The second metric is Average Condition-Specific Medical Costs. This reflects the sum of all medical claims costs for the specific condition, including both payer and patient paid amounts, divided by the number of individuals with this condition in the selected stratification (eg, a given year, county, age group, sex). Denied claims and “orphaned” adjustments have been removed from these cost calculations. These calculations do not include pharmacy costs for the condition.
To characterize health disparities across conditions and counties, 7 of the ACS variables that comprise CDC’s Social Vulnerability Index (percentage of persons below 150% poverty, percentage of civilian age 16+ unemployed, percentage of persons with no high school diploma age 25+, percentage of civilian non-institutionalized population with a disability, percentage mobile homes, percentage households with no vehicle, and percentage of persons in group quarters) were selected. Condition prevalence rates were compared between the top and bottom quartiles for each variable. Counties above and below the median SVI were also compared. Finally, large metro and nonmetropolitan counties were compared with metropolitan and nonmetropolitan counties according to the Urban-Rural Classification Scheme. Percent differences less than 5 percent were not reported in the dashboard.
This Snapshot is based on data present in the Georgia All Payer Claims Database as of November 2023. The GA APCD is still missing important payer data that will be added in the coming year. Georgia Medicaid and Medicare parts A and B data are not included in this Snapshot. Metrics may thus change in subsequent releases as these data and additional historical data are added.
The APCD has limited or no information on certain key demographic data including race, ethnicity, income, and education status, which hinders analyzing disease disparities on an individual level and adjusting estimates based on these variables.
Reported metrics that are derived from patient counts less than 11 individuals are suppressed and will not be included in dashboards or data. APCD data is de-identified, used, and disclosed with guidance from the US Department of Health and Human Services in accordance with section 164.514(a) of the Health Insurance Portability and Accountability Act (HIPAA) Privacy Rule.